Data in the format of streams are highly significant in today’s world. Numerous IoT devices, Credit cards, online financial transactions, and internet users generate huge volumes of continuous real-time data that needs to be analysed for operational purposes, anomaly detection, decision making, and derive insights.
Processing stream data in real-time is both a challenge and an opportunity for organisations. Hence, we’ll look at integrating two cloud platform tools (Azure Event Hubs and Azure Data Explorer) that could help organizations to seamlessly collect, analyse and visualise data streams at near real-time speed.
Azure Event Hubs
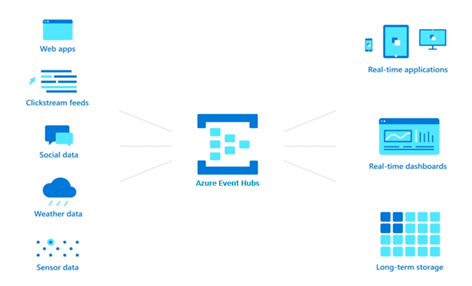
Azure Event Hubs is a big data event ingestion and streaming platform that can receive and process millions of events per second. Serving as an event ingestor pipeline, Event Hubs sits between event producers and event consumers to decouple the production of an event stream from the consumption of those events, by providing a unified streaming platform with time retention buffer for up to 90 days.
Data streams from a variety of sources (e.g. Transaction processing, Application logging, User telemetry, Device telemetry, etc.) can be captured in real-time by Event Hubs. Making it easier for business to focus on data processing rather than on data capture.
Azure Data Explorer
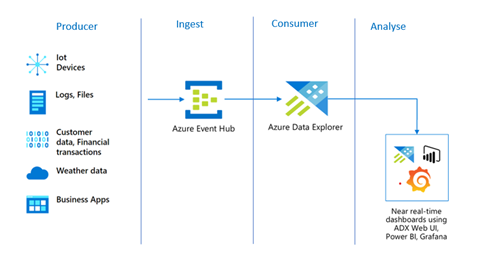
Azure Data Explorer is a fully managed, high-performance, big data analytics platform that makes it easy to analyse high volumes of data in near real time. Azure Data Explorer can be used for analysing structured, semi-structured, and unstructured data across time series. High volume raw (not fully curated) data can be ingested and analysed in near real-time, making it simple to extract key insights, serve data for live dashboards, spot patterns and trends, detect anomalies, and create forecasting models.
Out of the box, Azure Data Explorer serves as an all-in-one data ingestion, analyses and visualisation solution. Where captured data requires further downstream data analyses, Data Explorer has native integration with Power BI, native connectors for Grafana, Kibana and Databricks, ODBC support for Tableau, Sisense, Qlik, and more. Kusto Query Language (KQL) is the language for querying and analysing data in Data Explorer.
Architecture
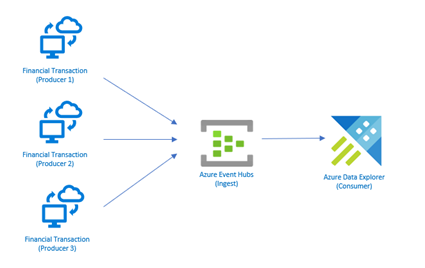
In this post, we will attempt to capture, analyse, and visualise daily trends of real-time stock market data of three top 10 tech companies (i.e. Microsoft, Apple and Google) using a Python application as the event producer, Azure Event Hubs as the capture tool, and Azure Data Explorer as the consumer and analyses tool.
Ingestion
Azure Event Hubs will be used as the Ingestion platform. There are two steps involved in creating an Event Hub:
Step 1:
Create Event Hubs namespace (provides a unique scoping container in which you create one or more event hubs)
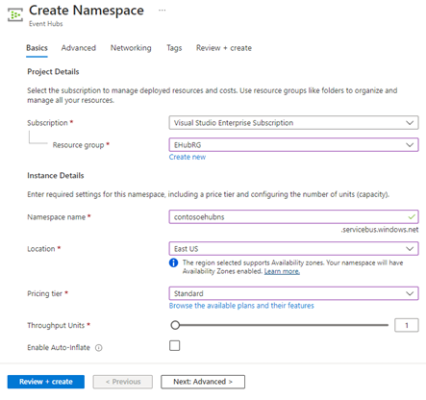
On the Create namespace page:
- Select the subscription in which you want to create the namespace
- Select the resource group
- Enter a name for the namespace (the system immediately checks to see if the name is available)
- Select a location for the namespace
- Choose Standard for the pricing tier
- Leave the Throughput Units (for standard tier)
- Select Review + Create at the bottom of the page
Step 2:
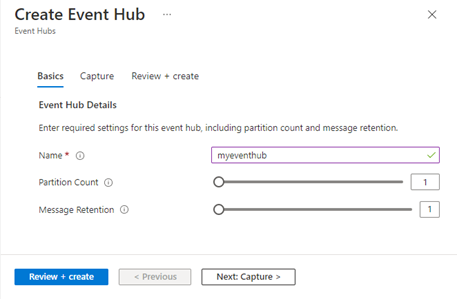
Create an Event Hub
On the Overview page, select + Event hub on the command bar:
- Type a name for your event hub, then select Review + create
- The partition count setting allows you to parallelize consumption across many consumers
- The message retention setting specifies how long the Event Hubs service keeps data
- On the Review + create page, select Create
Consumer
Azure Data Explorer will be used to store and analyse the stream data. Below steps are involved in setting up Azure Data Explorer for streaming data capture:
- Create Data Explorer cluster
In Azure portal, create a standalone Data Explorer cluster, or add Data Explorer pools (preview) to an Existing Azure Synapse Analytics platform. Start up the cluster, if it’s not already running (this can take up to 10 minutes).
- Create Database
Inside the cluster settings, click on Databases and add a new database
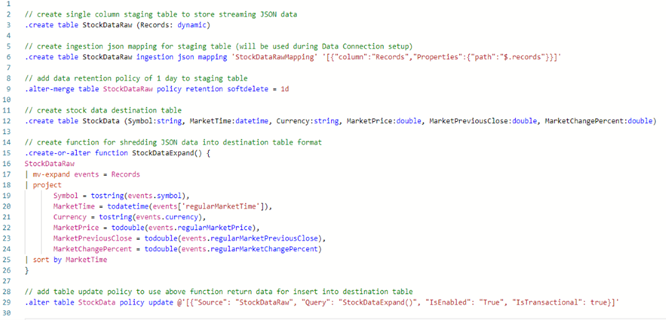
- Create Database Objects
Inside the cluster settings, click on Query to open the Explorer/KQL editor. Use below KQL code to create required database objects:
- Create Data Connection
Finally, under the Databases, click on the database created, click Data Connections then + Add data connection, choose Event Hub. Fill out the required setup information, most can be selected via drop the down menus (for Data format choose TXT), then click Create.
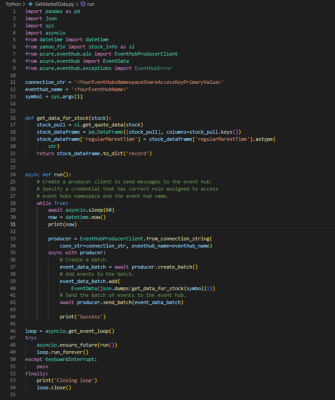
Producer
- A Python application is used to get real-time stock data at 60 seconds intervals and then streamed to Event Hubs. The target Event Hubs namespace’s Shared Access Key (primary key) and Event Hub name created earlier will be supplied as values for connection_strand eventhub_name script variables respectively.
Streaming
- In Visual Studio Code, run three separate sessions of the event Producer (Python app) simultaneously, one for each tech company. In order to get dynamic market movement data, it makes sense to run application during NYSE opening times (i.e. 2.30pm – 9pm Mon to Fri GMT).
Terminal 1: python GetMarketData.py msft
Terminal 2: python GetMarketData.py aapl
Terminal 3: python GetMarketData.py googl
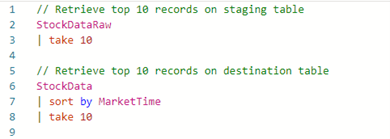
- In Event Hubs, check that you can see messages arriving
- Check Data Explorer staging table StockDataRawand destination table StockData are being populated. Note: data can take up to five minutes to arrive, so allow some time.
Allow sessions to run for about 6 hours, then stop. Note: programs will run in an infinite loop until a keyboard interruption input (Ctrl + C) or session terminal is closed.
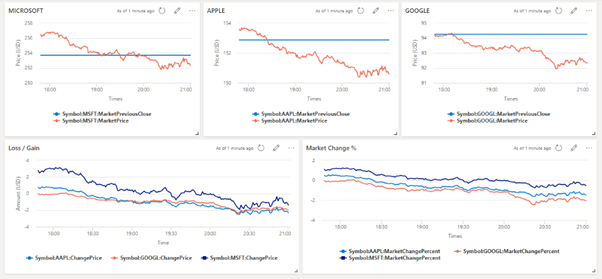
Visualisation
Below dashboard visual shows, in near real-time for each of the tech companies, current market stock price movements relative to previous day’s close.
Summary
Both Azure Event Hubs and Azure Data Explorer (ADX) are cloud based platformed that can quickly be provisioned. They are scalable and can be configured to specific organisational need.
Azure Data Explorer
ADX can ingest terabytes of data in minutes in batch or streaming mode. You can query petabytes of data, with results returned within milliseconds to seconds. Azure Data Explorer provides high velocity (millions of events per second), low latency (seconds), and linear scale ingestion of raw data. Ingest your data in different formats and structures, flowing from various pipelines and sources.
Kusto Query Language (KQL), used in Data Explorer, is simple to understand and learn, and highly productive. You can use simple operators and advanced analytics.
Useful for time series analysis with a large set of functions including: adding and subtracting time series, filtering, regression, seasonality detection, geospatial analysis, anomaly detection, scanning, and forecasting. Time series functions are optimised for processing thousands of time series in seconds.
Introduction to Data Wrangler in Microsoft Fabric
What is Data Wrangler? A key selling point of Microsoft Fabric is the Data Science
Jul
Autogen Power BI Model in Tabular Editor
In the realm of business intelligence, Power BI has emerged as a powerful tool for
Jul
Microsoft Healthcare Accelerator for Fabric
Microsoft released the Healthcare Data Solutions in Microsoft Fabric in Q1 2024. It was introduced
Jul
Unlock the Power of Colour: Make Your Power BI Reports Pop
Colour is a powerful visual tool that can enhance the appeal and readability of your
Jul
Python vs. PySpark: Navigating Data Analytics in Databricks – Part 2
Part 2: Exploring Advanced Functionalities in Databricks Welcome back to our Databricks journey! In this
May
GPT-4 with Vision vs Custom Vision in Anomaly Detection
Businesses today are generating data at an unprecedented rate. Automated processing of data is essential
May
Exploring DALL·E Capabilities
What is DALL·E? DALL·E is text-to-image generation system developed by OpenAI using deep learning methodologies.
May
Using Copilot Studio to Develop a HR Policy Bot
The next addition to Microsoft’s generative AI and large language model tools is Microsoft Copilot
Apr