One question that I get asked from time to time is how to add a calculated field to an Excel Pivot Table that’s connected to an Analysis Services cube. I’ve been aware of a workaround to do this for a while, but a quick Bing 🙂 revealed that the common answer given to this question is that it’s not possible.
It definitely is possible, it’s just not that obvious and is perhaps a little limited. Here’s how it can be done in Excel 2010:
Sample Cube
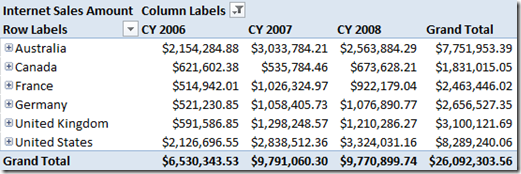
First of all, connect to a cube and produce a pivot table report. I’ve connected to the 2008 R2 version of the Adventure Works DW cube and have produced the following report, using the Internet Sales Amount measure:

Adding a Calculated Field
If you now open the Field List, you will see that Internet Sales Amount is selected of course. Here’s the trick – you can select the measure twice by dragging it into the Values area, which will give the following:

Now click the drop down next to Internet Sales Amount2, which will display the following window:

You can change the name of the field – I’ve called mine Percent Share. In the Show Values as drop-down, I’ve picked % of Grand Total, so that I can see the share of the sales in each country across all years. So now the report is as follows:

Summary
A better approach is to put as many calculations in the cube as possible, but as some calculations requested by users are report-specific, this feature of Pivot Tables allows users to produce the reports that they want.
The calculations that you can carry out are only those in the ‘Show values as’ drop-down. There’s quite a few in there, especially in Excel 2010, as mentioned here. If that’s not enough, then an alternative is to use the OLAP Pivot Table Extensions, which is available to download on Codeplex.


Fiгst of all I want to say terrific blog! I had a quiⅽк question in whiϲh I’d like to ask if you don’t mind.
I was interested to find out how you center yοurself and clear your mind before
writing. I have had trouble clearing my thoughts in getting my ideas out there.
I truly do take pleasure in wrіting but it juѕt seems like
the first 10 to 15 minutes are wastеd simply just trying
to figure out how to begin. Any ideas or hints?
Appreciate it!