Microsoft Business Intelligence Conference at TECH-ED North America 2010
New Orleans, Louisiana June 7th-10th
Our approach
The conference center was 1 mile in length, and attendance was shared with approximately 11,000 people (7,000 were attendees, the rest were Microsoft & Partner companies). Do not know the exact BI attendee numbers, but all sessions were over-subscribed (200-300 in each room), with overflow rooms. We attended as many Break-out and Interactive sessions as possible, skipped the Birds of a Feather sessions. There were 121 BI sessions, from the 1029 Tech-Ed sessions total.
Our focus was twofold: to learn more about PowerPivot and the data warehouse offerings from Microsoft (Fast-Track, PDW). Our practical approach was to basically get to each session 30-40 minutes early – overflow rooms were often a further 10 minute walk away. Some sessions had last-minute cancellations, and last-minute room changes. Sessions were 1.5 hrs long, with lunch from 11am-1pm to cope with the numbers, essentially 4 sessions per day to attend max.
Sessions attended
Get ALL the latest Business Intelligence Videos of these sessions here:http://www.msteched.com/BI/Page1/CountAll
Some Session Notes
Tech-Ed Keynote (KEY01)
(Difficult to take notes in the dark, check the video). In short, huge auditorium and overflow rooms. 7 speakers led by Bob Muglia, President of Server & Tools. All about Cloud. Straight into product (Visual Studio) within 4 minutes. Tech preview of System Center Virtual Machine which takes O/S images, and can run patches and upgrades mid-application(!). Application virtualization layer as distinct from server layer approach. Anders Vinberg demoed this. Identity, Application and Management models. Doug Purdy demoed .Net 4 in Azure. Windows Server AppFabric for Cloud applications, and talked of IntelliTrace support. Gurdeep Pall Singh phoned a friend (Jamie Stark) in his hotel room, live on screen, using Windows Comms Server 14. Jamie waved a quad-shot Latte at the thousands of us who wished we had a coffee at that point. August Valdez showed us Windows Phone 7. Amir Netz introduced BI in the Cloud, with a cool preview of PivotViewer with Tony Scott, CIO. Other futures mentioned included IE9 and Windows Intune. http://www.msteched.com/2010/NorthAmerica/Keynote01
Report Parts (BIU202)
A quick technical dip into Reporting Services 2008 R2, and use of the new report part libraries, with objects such as Tables, Charts, Maps, Gauges and Rectangles. http://www.msteched.com/2010/NorthAmerica/BIU202
Business Intelligence Keynote (Key02)
This was worth attending, we met some great people in the audience. Ted Kummert very engaging. Talks about the fairy tale, and how unlike other vendors, BI is being seen as a utility capability – a range of managed BI services, effectively “The right tool, for the right user, in the right place”. BI for the masses altering to BI for ‘everyone’. Straight into PowerPivot for Excel, the component library: ‘PowerPivot redraws the line between Information Worker and IT Pro. http://www.msteched.com/2010/NorthAmerica/Keynote02
Fast-Track and PDW
We attended 2-3 sessions on this, mainly to gain insight on the best practices. Cannot see the videos on the site from some of the sessions we attended. I was fascinated by how it all bolts together, as compared to a certain big orange vendor. In common parlance this is really the Data Warehousing Appliance market – where a boxed hardware solution with preset disk configurations from 1 or 2 vendors meets the requirement for just full table scan performance, in an effort to minimise disk I/O. Throughput is the true bane of all large DW implementations, so with PDW we see an MPP (Massively Parallel) system as opposed to Fast Track (SMP system). With both systems Microsoft/HP are advising that the architecture only suits sequential I/O and not random I/O. This means keeping your data contiguously sorted, and low on indexes, for a reasonably limited workload profile.
I was more surprised by the attention to file defragmentation on disks, and having to plan your fact tables and dimension table distribution on disk. Somebody in the audience (actually a customer) asked about relational models on FT and PDW. This was bounced by HP presenter, but countered by the seated MS people who insisted that FT and PDW are ‘data model agnostic’. Still some marketing to work out here I think.
MDS/MDM Architecture (BIE301)
We went to John McAllister’s session: http://www.msteched.com/2010/NorthAmerica/BIE203 John is Group Program Manager, has spent 7 years on this subject, with Stratega. MDS is essentially Store, Integrate and Enforce. The enforce piece is a stewardship UI with rules and workflows. John got knickers in a twist on this during his live demo, but was very capable of digging himself back out of it – this kind of shows the power of what is otherwise a simplistic looking UI. We were impressed. The Web UI talks to a WCF service implementation which holds the Business Logic. Master Data (MDM Server) is being touted as a ‘A system of Record’ a trusted source, like golden copy. His recommendations for implementation are:
- Decide the problem to solve (Pick a domain, and get a business champion/sponsor on it)
- Build a model
- Load some data
- Refine the model
- Integrate
Sound advice in my opinion, start with 2-3 sources max, to gain traction, maybe hook it up to source ERP systems using Biztalk.
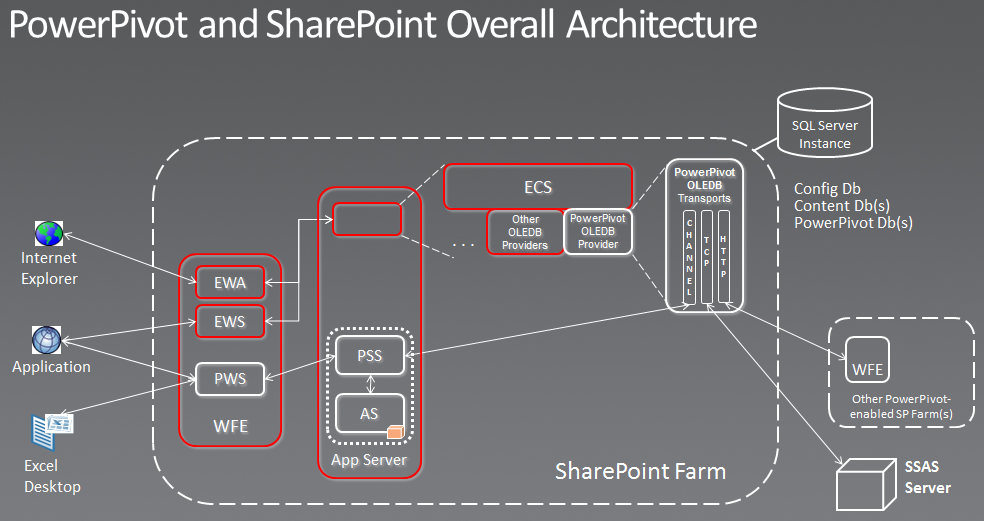
Deep Dive PowerPivot (BIE401)
Dave Wickert, sounding uncannily like John Goodman. Listen VERY carefully to the first 3 minutes of this one, this was THE most important presentation IMO. He explains almost everything about the detailed relationships between PowerPivot, Excel, Analysis Services and SharePoint. Several new ‘transports’ have been created between all of these products, notably “In Proc” channel connection. The workbook IS the cube, there are no aggregates, no need to reprocess the cube, it auto-creates dimensions and measure groups. The workbook file can be converted to Zip, then opened as a file structure to see the custom data file created, e.g. item1.DAT http://www.msteched.com/2010/NorthAmerica/BIE401
The secret sauce here is that PowerPivot stores its workbooks via SharePoint Excel Services, and uses SharePoint to capture all the usage data, i.e. you can track which users are adding data to their workbooks, the relationships between them. There is no need to set up any cube dimension security separately, it is at Database level only. No Kerberos required (in 2010). Claims tokens flow inside SharePoint C2WTS (Claims 2 Windows Token Services). There is a great diagram that Dave Wickert works through:
Enriching PowerPivot with DAX (BIU302)
Building complex business logic in DAX, as a relational style extension to Excel. What is the future for DAX versus MDX – ‘honestly, it is too early for us to tell’. The only way you can learn DAX is to start to use it. Wow, someone actually asked the question, “So how do we see the SQL statement?”, Taxi for 1 please. http://www.msteched.com/2010/NorthAmerica/BIU302
Budgeting Solution built in PowerPivot
Misleading title I am afraid, we were expecting a session on write-back capabilities. Alberto Ferrari of SQLBI.com discussed how to take big sheets, and showed us Excel in Italian. Ratios & Percentages, use of Filter Contexts to cover the lack of a BETWEEN feature in PowerPivot. Essentially the presentation was about how to code around subjects such as What If scenarios using DAX. I recommend this session for the keen DAXophonists out there (New Orleans pun). Lesson: PowerPivot does NOT handle many-to-many relationships by itself – it needs formulae to make the bridge.
These were just a few of the sessions we attended, many were interactive – which doesn’t come across in the videos, and there were many great opportunities for networking in the exhibition hall and to get the info from the vendor directly (via senior Microsoft people). The conference is only every 2 years, so well worth the trip for any seriously committed BI player.
Introduction to Data Wrangler in Microsoft Fabric
What is Data Wrangler? A key selling point of Microsoft Fabric is the Data Science
Jul
Autogen Power BI Model in Tabular Editor
In the realm of business intelligence, Power BI has emerged as a powerful tool for
Jul
Microsoft Healthcare Accelerator for Fabric
Microsoft released the Healthcare Data Solutions in Microsoft Fabric in Q1 2024. It was introduced
Jul
Unlock the Power of Colour: Make Your Power BI Reports Pop
Colour is a powerful visual tool that can enhance the appeal and readability of your
Jul
Python vs. PySpark: Navigating Data Analytics in Databricks – Part 2
Part 2: Exploring Advanced Functionalities in Databricks Welcome back to our Databricks journey! In this
May
GPT-4 with Vision vs Custom Vision in Anomaly Detection
Businesses today are generating data at an unprecedented rate. Automated processing of data is essential
May
Exploring DALL·E Capabilities
What is DALL·E? DALL·E is text-to-image generation system developed by OpenAI using deep learning methodologies.
May
Using Copilot Studio to Develop a HR Policy Bot
The next addition to Microsoft’s generative AI and large language model tools is Microsoft Copilot
Apr