In a recent project, one of the business areas which required modelling was that of survey data. This can often be quite tricky, due to the fact the data is not so quantitative in nature as other business areas such as sales.
How do you go about calculating measures against this type of data? In this blog I will go about explaining a relatively simple model you can use to achieve this goal.
Master Data Services
To aid with modelling I used Master Data Services (MDS) to help map the questions and responses from the surveys.
The idea behind using MDS is that regardless of the questions asked, whether it be in one format or another, English or Spanish, you can map them to a set of master questions. Usually these will align closely to your measures/KPIs and should be relatively finite in number so that the mapping process is feasible for a business user. In my business case, the master set of questions revolved around items such as quality, price, and promotion of products. For responses, I needed to map these to a flag which indicated we wanted the response to contribute towards a measure and ultimately a KPI.
I first created the following entities in MDS.
- Survey (holds the survey name, a unique identifier for the survey, and in my case I also created a master survey lookup to group the surveys together)
- Source Question (holds the distinct set of questions assigned to each survey, along with identifying codes, and question orders – each question would also be mapped to a master question)
- Source Response (holds a set of response options for each question, along with identifying codes)
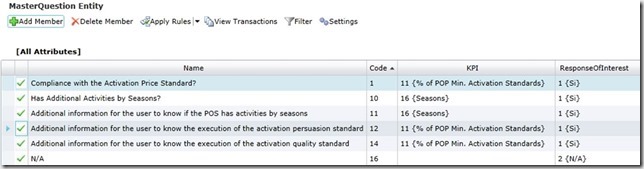
- Master Question (holds the master set of questions and joins to the KPIs)
- KPI (holds a list of KPIs that you need to address by aggregating response data)
- Response of Interest (holds a list of responses that are regarded as positive / contributing towards the KPI when answered by the question)
- Response of Interest Mapping (allows the user to map the response options available on each question to a response of interest)
In terms of the response of interest, I was only interested in responses where the answer from the survey was “Yes” so this was all that was required here. However for more complex response options, the model can provide the scalability required. For instance, if you were looking for an answer between 7-10 and the survey had been answered with a 7, 8, 9, or 10 – each of these could be mapped to 7-10 without having to create responses of interest for all particular combinations. This scales well and can cover scenarios for instance where the answer should be between 700 to 1000 in the same way.
I also created a Master Question and Response of Interest value for N/A. This way, only the blanks on the mapping entities required populating and the user was never unsure whether a blank represented a question/response that was not of interest, or something that required mapping still.
All the entities above apart from Master Question, KPI, and Response of Interest were populated automatically from ETL with a SQL script used to extract the contents of those entities from source. The other 3 entities were populated manually by a business user. I also locked the entities / columns that the user shouldn’t be changing by using read-only permissions.
Some examples of the manually populated tables can be seen below:


Data Warehouse
For modelling the tables in the data warehouse, I created a separate dimension for each of the Response, Question, Survey, and KPI entities, and a single Fact to capture the responses of interest against these dimensions.
The majority of dimension lookups were straight forward along with the response of interest measure which can be seen below:
SELECT
SU.Code AS SurveyId,
SR.Name AS ResponseName,
1 AS ResponseOfInterest
FROM mdm.PL_ResponseOfInterestMapping RM
INNER JOIN mdm.PL_SourceResponse SR
ON RM.SourceResponse_Id = SR.Id AND RM.Survey_Id = SR.Survey_Id
INNER JOIN mdm.PL_Survey SU
ON RM.Survey_Id = SU.Id
WHERE
RM.ResponseOfInterest_Code IS NOT NULL AND RM.ResponseOfInterest_Name <> 'N/A'
During our ETL runs for the fact we also checked for responses that had not been yet mapped – and did not pull these through.
If you then have a cube sat on top of your DW, you can then write measures across the fact to count the number of responses of interest. An example of which can be seen here:
Price Activation Standard:=
COUNTROWS(
    FILTER(
        CALCULATETABLE('Outlet Survey','KPI'[Sales Driver] = "Price"),
        'Outlet Survey'[IsResponseOfInterest] = 1
    )
)
This was then checked against a Target fact table to calculate the compliance and the KPI was essentially an aggregation of the compliance across geography.
Summary
Overall, the model has proved very popular with the business. It’s easy to understand and gives the business control over which responses to count towards the KPI – without having to hard code values into the ETL which had been seen in previous solutions. It can also be extended easily be adding new KPIs and mapping them to new master questions without having to change any ETL. From a development perspective it also means that nothing should go into the DW as Unknown for a Dimension since the SQL to populate MDS, can also be used for the DW and therefore should always match.
If you have any questions, please feel to ask them in the comments.
Introduction to Data Wrangler in Microsoft Fabric
What is Data Wrangler? A key selling point of Microsoft Fabric is the Data Science
Jul
Autogen Power BI Model in Tabular Editor
In the realm of business intelligence, Power BI has emerged as a powerful tool for
Jul
Microsoft Healthcare Accelerator for Fabric
Microsoft released the Healthcare Data Solutions in Microsoft Fabric in Q1 2024. It was introduced
Jul
Unlock the Power of Colour: Make Your Power BI Reports Pop
Colour is a powerful visual tool that can enhance the appeal and readability of your
Jul
Python vs. PySpark: Navigating Data Analytics in Databricks – Part 2
Part 2: Exploring Advanced Functionalities in Databricks Welcome back to our Databricks journey! In this
May
GPT-4 with Vision vs Custom Vision in Anomaly Detection
Businesses today are generating data at an unprecedented rate. Automated processing of data is essential
May
Exploring DALL·E Capabilities
What is DALL·E? DALL·E is text-to-image generation system developed by OpenAI using deep learning methodologies.
May
Using Copilot Studio to Develop a HR Policy Bot
The next addition to Microsoft’s generative AI and large language model tools is Microsoft Copilot
Apr