The cloud warehouse is a different beast to the on-premise systems most of us have been using for the past decade. These times, they are a changing. I’ve talked about the key concepts that we, at Adatis, see as core to this new world here, but how does this work in practice? To start us off, the core of any BI Developer’s skillset – ETL.
The main two players are Azure DataWarehouse and Azure Data Lake. I recently gave a talk to SQLBits to introduce some key concepts, explain how I see them fitting in to the new world and, hopefully, challenge some existing preconceptions – slides can be found here. I’ll pop the video link up when published.
For those in a hurry, I’ve summarised the main thrust of my talk below.
The Ways of the Past
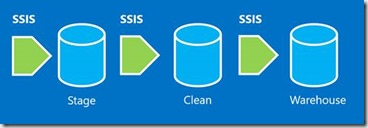
For many years, the fastest way to transform data whilst moving it between two places was to extract, transform in memory via SSIS, then load into their final structures, hence ETL.
![clip_image002[4]](https://adatis.co.uk/wp-content/uploads/historic/simonwhiteley_clip_image0024_1.jpg "clip_image002[4]")
However – this was eventually rivalled by massive parallelism, whilst one database engine may be slower to work through a load than memory-based operations, 10 might be much faster. But the Hadoop systems that provided this, were not very accessible to the bulk of BI developers, seen as requiring different skillsets and not being particularly standard.
The management of these clusters wasn’t always achievable even with developer acceptance, certainly not in the on-premise world. This is why the latest Azure technologies are looking to make such a difference.
The Scalable Warehouse
With Azure Data Warehouse, you can perform queries over large, distributed tables – both reading and writing using massive levels of parallelism, depending on your service tier. You can also scale your service dynamically, so if your day-to-day usage required 100 DWUs, you’d be seeing 8 reader threads and 60 writer threads. Even at this level you may find performance to be similar to SSIS.
But these are PaaS components and so are incredibly flexible and scalable. We can scale our ADW instance up to 400 DWUs just for the duration of our data load (bear in mind, you pay by the hour for the maximum level used in that time). This gives us 32 readers and 60 writers – at this level we’ll be far outstripping the performance of a powerful SSIS box and this will cost us just a couple of pounds per hour. This scaling can be done via a number of methods – a couple of lines of T-SQL, a simple powershell script or even through the UI.
Once we’ve scaled, transformations are quite likely to be faster performed directly by our data warehouse engine than a data movement tool. This gives us Extract > Load > Transform, which is a common technique by users of MPP systems – with Azure DW coming from APS/PDW this makes sense.
![clip_image004[4]](https://adatis.co.uk/wp-content/uploads/historic/simonwhiteley_clip_image0044_1.jpg "clip_image004[4]")
Targeted Compute
With Azure Data Lake Analytics, you can spin up the equivalent of 1000 cheap servers (essentially managed Hadoop instances) for the lifetime of your query. You’ll need to write U-SQL to do this, a new language combining C# and SQL syntax, but it’s not a huge leap for an experienced SQL developer with just a hint of programming skills. But the ability to write a query directly in the browser that can utilise massive amounts of parallelism removes a lot of barriers – you don’t even need visual studio installed to take advantage of ADL.
Of course, if you do build your queries in visual studio, there is a whole tooling set released to allow you to predict compute utilisation, spotting bottlenecks and planning capacity. Not to mention the benefits that source controlling your code give you!
![clip_image006[4]](https://adatis.co.uk/wp-content/uploads/historic/simonwhiteley_clip_image0064_1.jpg "clip_image006[4]")
So Which Do We Use?
This gives us two options for our transformation, the Data Lake and within the Warehouse itself.
My assumption is that we’re going to see TELT, some upfront targeted transformation, then an extract/load into our final technology, then some further transformation.
Transform (targeted) > Extract > Load > Transform (general)
Whereas transformation used to be the bottleneck, it’s now the data movement itself that’s slowing things down. If we have just one very large job, we can perform this in isolation within the lake before moving anything and not have to scale our warehouse. If we have a lot of transformations to do on a variety of tables, we can scale up the warehouse for the duration. Maybe we do both to limit how much we scale the ADW. Perhaps we perform the transformation as increments throughout the day, either as smaller data lake jobs, data factory movements or even stream transformations. Once again, that’s what a distributed cloud architecture gives us – flexibility and choice.
The actual answer depends heavily upon the data scenario that you’re attempting to work with – the speed of incoming data, the types of data involved, the volume and complexity of the data. The new components do not provide you with a one-size-fits-all answer, they do, however, provide you with the tools to overcome almost any data challenges you may be facing.
Further Reading
Azure DataWarehouse Loading Reference Guide
Azure Data Warehouse Documentation
Azure Data Lake Analytics Documentation
Introduction to Data Wrangler in Microsoft Fabric
What is Data Wrangler? A key selling point of Microsoft Fabric is the Data Science
Jul
Autogen Power BI Model in Tabular Editor
In the realm of business intelligence, Power BI has emerged as a powerful tool for
Jul
Microsoft Healthcare Accelerator for Fabric
Microsoft released the Healthcare Data Solutions in Microsoft Fabric in Q1 2024. It was introduced
Jul
Unlock the Power of Colour: Make Your Power BI Reports Pop
Colour is a powerful visual tool that can enhance the appeal and readability of your
Jul
Python vs. PySpark: Navigating Data Analytics in Databricks – Part 2
Part 2: Exploring Advanced Functionalities in Databricks Welcome back to our Databricks journey! In this
May
GPT-4 with Vision vs Custom Vision in Anomaly Detection
Businesses today are generating data at an unprecedented rate. Automated processing of data is essential
May
Exploring DALL·E Capabilities
What is DALL·E? DALL·E is text-to-image generation system developed by OpenAI using deep learning methodologies.
May
Using Copilot Studio to Develop a HR Policy Bot
The next addition to Microsoft’s generative AI and large language model tools is Microsoft Copilot
Apr