I’ve blogged about some of the financial consolidation elements of PerformancePoint planning before. Most of the elements related to financial consolidation e.g. Share calculations, intercompany transactions etc are specific to consolidation and only implemented when performing some form of statutory consolidation. Currency conversion, on the other hand, can be common to any element of PerformancePoint Planning whether it’s a budgeting, forecasting, planning or, in fact statutory consolidation solution.
In it’s simplest, out of the box, form, currency conversion is pretty straightforward. You need an exchange rate assumption model to hold the exchange rates and you need a financial model without shares that contains a pre-defined currency conversion rule that utilses the exchange rate assumption model. You run the pre-defined rule on a set of financial data and currency conversion is calculated for you. There’s little more to it than that.
This post looks a little (and I mean a little) deeper in to currency conversion and demonstrates the triangulation features contained within PPS-P.
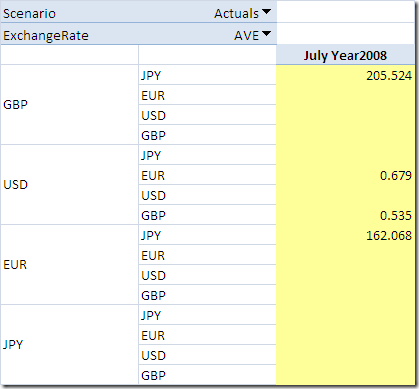
Consider this set of exchange rates, taken from www.xe.com today:
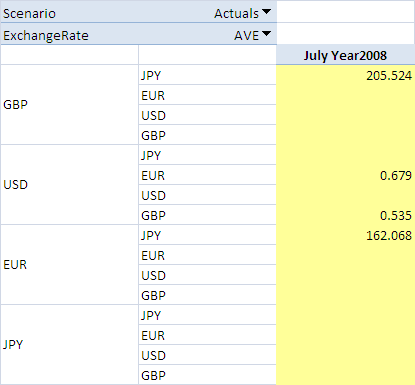
On the face of it, we have a few rates that allow us to convert from British Pound to Japanese Yen, US Dollar to both British Pound and Euro, and finally a rate for converting Euro to Japanese Yen.
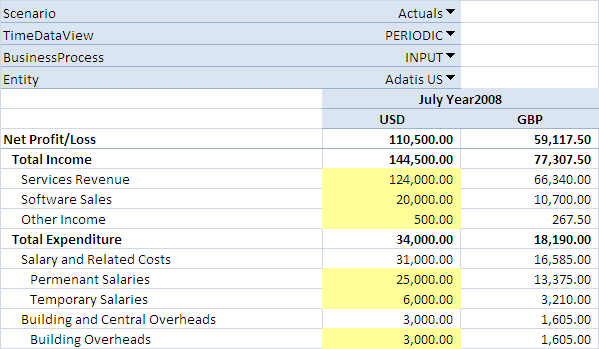
When the in-built currency conversion rule is run against, for example, a set of US financial data we can determine the British Pound equivalent. The Net Profit/Loss of 110,500 USD, converted to British Pound at a rate of 53.5 British pence per dollar converts to 59,117.50 GBP – As you would expect:
What would happen if we were to run the currency conversion rule again but this time try and convert the US Dollar figures to Japanese Yen?
The astute among you would point out that we don’t have an exchange rate for converting US Dollar to Japanese Yen. The more astute among you might say that we could determine the JPY figures by first converting to GBP and then converting the GBP figures to JPY. The even more astute among you might suggest that you could calculate the Japanese Yen two ways, either by first converting to GBP and then to JPY or by first converting to EUR before converting to our desired JPY.
Who’s right? Well, all of you, kind of!
If I run the currency conversion job again but instead of selecting GBP as the reporting currency, I select JPY, I get the following result:

No conversion ! Why – well, we don’t have an exchange rate set for converting USD to JPY!
This is where triangulation comes in. With our current set of exchange rates there are two methods for converting USD to JPY. Either through GBP or EUR. You set which ‘route’ the triangulation takes by setting the model property ‘Default Currency’. By default this is not set, hence our failed conversion above.
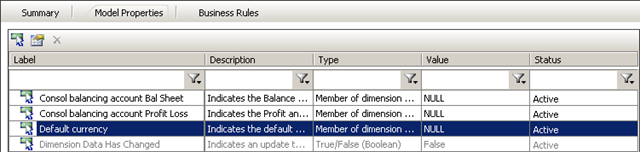
However, if you were to set it to either GBP or EUR you will get some results, but there is a catch – the ‘route’ you take returns different results. Incidentally, you don’t have to redeploy the model when you change the property you just need to save the model.
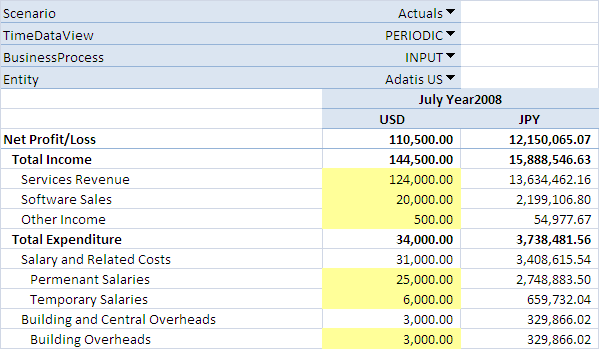
Triangulate through GBP
110,500 USD at a rate of 0.535 equals 59,117.50 GBP. Convert the GBP to JPY at a rate of 205.524 and that equates to 12,150,065.07 JPY.
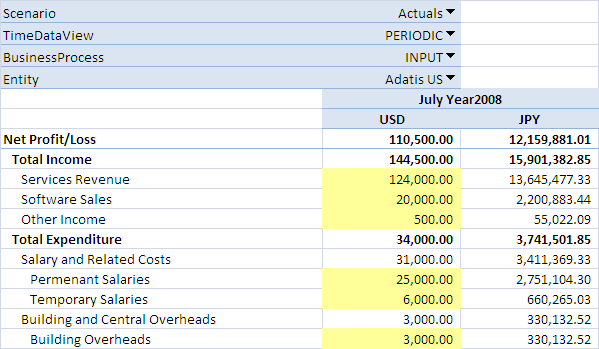
Triangulate through EUR
110,500 USD at a rate of 0.535 equals 75,029.50 EUR. Convert the EUR to JPY at a rate of 162.068 and that equates to 12,159,881.006 JPY.
The two ‘routes’ highlight a variance of 9815.936 JPY (about 90 USD)! A triangular arbitrage !
So, two questions:
1) Which ‘route’ should you use?
That’s a business decision and if it’s going to be a common conversion then direct rates ought to be favoured over triangulation.
2) How do you exploit this model to work out guaranteed triangular arbitrage to make millions through currency trading?
I’m working on it !
Introduction to Data Wrangler in Microsoft Fabric
What is Data Wrangler? A key selling point of Microsoft Fabric is the Data Science
Jul
Autogen Power BI Model in Tabular Editor
In the realm of business intelligence, Power BI has emerged as a powerful tool for
Jul
Microsoft Healthcare Accelerator for Fabric
Microsoft released the Healthcare Data Solutions in Microsoft Fabric in Q1 2024. It was introduced
Jul
Unlock the Power of Colour: Make Your Power BI Reports Pop
Colour is a powerful visual tool that can enhance the appeal and readability of your
Jul
Python vs. PySpark: Navigating Data Analytics in Databricks – Part 2
Part 2: Exploring Advanced Functionalities in Databricks Welcome back to our Databricks journey! In this
May
GPT-4 with Vision vs Custom Vision in Anomaly Detection
Businesses today are generating data at an unprecedented rate. Automated processing of data is essential
May
Exploring DALL·E Capabilities
What is DALL·E? DALL·E is text-to-image generation system developed by OpenAI using deep learning methodologies.
May
Using Copilot Studio to Develop a HR Policy Bot
The next addition to Microsoft’s generative AI and large language model tools is Microsoft Copilot
Apr