Once you have users accessing your cube it’s almost inevitable at some point that someone will ask you to generate usage statistics from it, and there are a number of methods to achieve this. In this quick blog post, I’ll detail them and my experiences with each, and then use this data to create a PBI report.
Native Tabular Properties
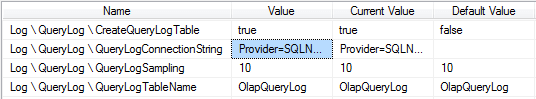
The first method is natively through the tabular cube properties. This also has the added bonus (read impact) that it will optimise future aggregations based on usage – in fact that’s its main purpose.
This can be done by setting the CreateQueryLogTable to true, setting up the QueryLogConnectionString (to point to the DB where the usage table requires hosting), setting the QueryLogSamping rate (10 means every 10th query will be logged), and finally the name of the QueryLog table.

Advantages of this method is that its very easy to setup with limited knowledge required and it could potentially improve performance if you have an environment where users submit repetitive queries. Unfortunately there are also a number of disadvantages which led me to find other methods. Firstly, it creates a degree of overhead on the cube if its sampling too often; we actually had visible performance related complaints once we turned it on – either through the sampling or change to the “optimised” aggregations. Depending on the sampling rate, you could also find that users who rarely use the cube are not picked up as part of the stats. As well as this any changes to the cube structure will cause the logging table to be reset. The table is also limited in terms of what it actually logs (as you can see below) – useful if you just want just the user and timestamp info but not much else, and no real ability to configure.
AS Trace
To that extent, I looked for other tools to do the same task but better and I found AS Trace.
Originally built for SQL Server 2012, it works fine on 2014 – and provides you the ability to run a trace against the cube activities (and log to a table) exactly like the SQL profiler but without the overhead of the GUI which adds unnecessary memory/processor power. It also runs as a windows service allowing it to restart automatically when the server reboots. If this is the case, the tool also logs the existing data to a History table and truncates the logging table. Exactly what I was after.
The tool collects information based on a preconfigured Analysis Services Profiler template, which can be optimised depending on which events you are interested in. I initially ran it using most events selected, and with a limited user set it was generating in the region of 25,000 rows a day. This was clearly not maintainable for a long period of time. I then used the following blog post to understand what each event of the profiler was giving me and then just created a lightweight trace definition file to give me what I wanted. I limited it to Query Begin, Query End (for DAX/MDX statements) and Audit Logon/Logout (for session data).
The setup is very straight forward, just run the install.bat as an escalated privileged account, and check it installs the service correctly. Next, add your SSAS service account to the Logon of the service, make sure the account has “Log on as Service” and membership to the database you are writing to in the form of DDL and DML access, i.e. able to create tables, write to tables – and lastly admin rights to the instance of SSAS you intend to use.
Next, configure the ASTrace.exe.config file with the parameters you want the tool to use. This includes the location of the cube (can handle multiple cubes), the location of the trace definition file, the location of the DB instance and table you want to log to and lastly whether you want to preserve history on restart. The only thing I couldn’t do here, is set the schema of the table it was using to log to, which defaults to dbo.
All that’s left is to start the service, and check the log file to see if it has created any errors on start-up. If not, the table should be created correctly and awaiting input.
I also saw another method while researching using Extended Events (XEvents) but did not implement this once AS Trace provided me with the information I needed.
View / Power BI Report
I initially used the data to run a limited set of queries to extract total users, and total queries for a given time period. This was useful to a degree but from the data collected I realised I could be doing so much more.
This lead me to do some analysis across the type of metrics being logged, and allowed me to create a view on top of the tables of what I thought might be useful on a report. I removed all the redundant columns it was tracking, and created some friendly names for the EventSubclass, and other columns. I used the PATINDEX function to check the query statement for existence of some important values – while not an exact science, it would give me a good picture of the split between certain user groups and KPIs being run. I’ve included the view definition below.
I ended up limiting the data to EventClass 10 as this seemed to capture all the necessary data. The only downside I have seen so far is that users querying through the Power BI web service are anonymised under the service account name. I’m currently looking into options to resolve this which I’ve seen as configuration options on Power BI – to allow through the username as long as it can be matched at the other end.
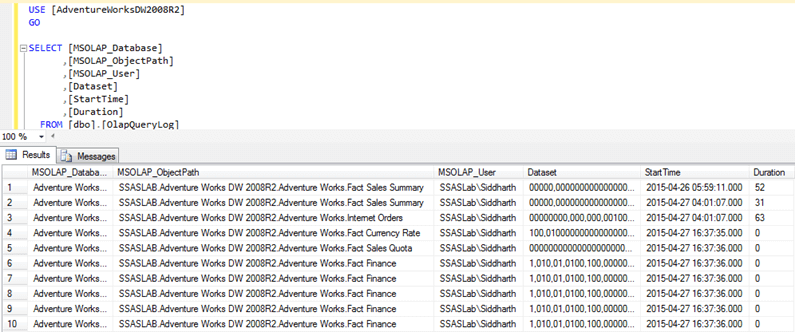
SELECT
RowNumber AS ID,
SPID AS SessionID,
CurrentTime AS DateQueried,
NTUserName AS Username,
CASE EventSubClass
WHEN 0 THEN 'MDX Query (Excel)'
WHEN 3 THEN 'DAX Query (Power BI)'
WHEN 1 THEN 'METADATA Query'
END AS QueryType,
CASE Success WHEN 1 THEN 'Successful Query' ELSE 'Query Error' END AS SuccessfulQuery,
CONVERT(DECIMAL(10,2),CONVERT(DECIMAL(18,3),CPUTime)/1000) AS CPUTimeSec,
CONVERT(DECIMAL(10,2),CONVERT(DECIMAL(18,3),Duration)/1000) AS DurationSec,
TextData AS Query,
CASE PATINDEX('%Mexico%',TextData) WHEN 0 THEN 0 ELSE 1 END AS MexicoMarket,
CASE PATINDEX('%Colombia%',TextData) WHEN 0 THEN 0 ELSE 1 END AS ColombiaMarket,
CASE PATINDEX('%CS4%',TextData) WHEN 0 THEN 0 ELSE 1 END AS CS4,
ServerName
FROM
[dbo].[ASTraceTable]
WHERE
EventClass = 10
Once I had the view, creating the report was relatively straight forward, and can be seen below.
I included metrics for number of queries by user (blurred out) which also doubled as a filter, the % split of queries for things such as Excel/Power BI, a measure of queries by timeframe, a logarithmic scaled display for queries by query duration, and lastly a split of queries by KPI. I intend to tweak these once I receive more data from the trace, but was relatively happy with the information that they were providing.
")
Please let me know if you have any comments.


This is awesome.
I’m looking to do something similar with Power BI and AS Trace. Any chance you would be willing to share a generic .PBIT? Love the visuals and measures.
Thanks! Unfortunately I had the same request from someone internally, but when I went to search for the pbix, I had left it on a clients source control. Unfortunately I’ve lost access to this now. The view is the hard bit here, the visuals can probably be re-created fairly easily from the screenshot.
Thanks for the article, Tristan! Do you have an idea if AS Trace works with newer versions of SSAS? I’m using 2017 and was wondering if you have tried it also there.
I’m afraid I have not. Hopefully they are keeping it up to date!