For those who are new to Power BI Paginated Reports, this blog should help you hit the ground running and create reports with high productivity.
For those who don’t already know, Power BI Paginated Reports is similar to SSRS with some different features. And so, this blog could also be used to understand SSRS as well.
Minimise Datasets where you can
When you create datasets for a report, you want to minimise the amount of them. Instead of having a dataset per Tablix you want to repeatedly use the same datasets.
There are two main reasons to minimise datasets:
- Simplicity
- Performance
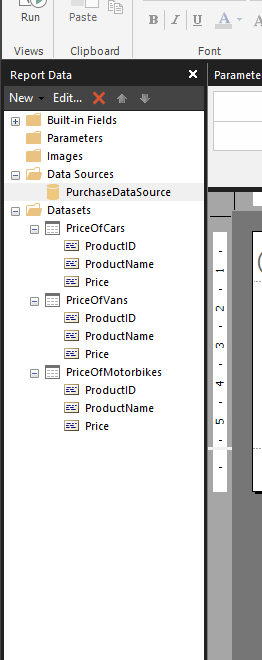
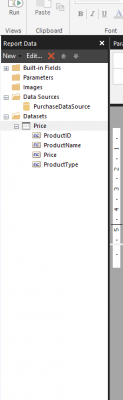
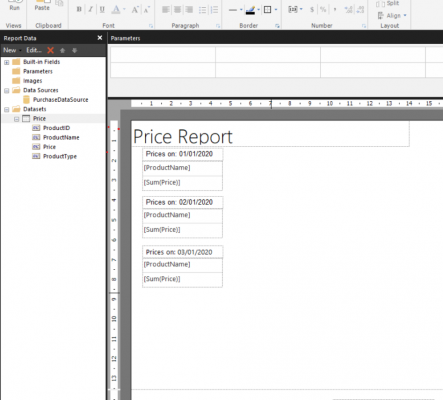
By minimising datasets, you will be reducing duplication. Fixing one dataset will always be easier than fixing multiple datasets. We should aim to achieve the reduction of redundant datasets. The first image shows the price of a product broke down into datasets based on the product type, but instead we should aim for the image on the right, where we have one dataset and where we aren’t applying a filter on the dataset level.
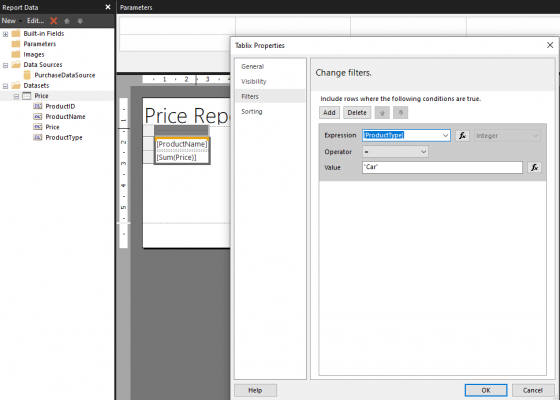
When you want to add a filter to the data, add it on a report level instead of the dataset level. Report level filters will help minimise what could be an endless mess of datasets.
However, you must be sensible with your datasets as well, having one giant dataset with billions of rows and endless measures is not performant or simple, it is preferable to break it down and reduce the granularity.
Don’t use the Visual Designer, write your queries out first
As tempting as it can be to drop and drag fields and parameters into your dataset, I would not recommend it. It makes it harder to repeatedly test, share the logic in the query, and see the results. Instead, write the script, whether it be in DAX or SQL. Writing the queries is a faster process that gives you a lot more control over your queries. If you don’t understand SQL or DAX to a proficient enough level, don’t panic, you could start the query with the visual designer and then convert it to the script.
When you’re running your DAX queries, don’t use the dataset query designer in the report builder, use DAX studio. DAX studio gives you the ability to efficiently query, format, and test DAX. As an experience it’s much faster and easier to show other people. If you are using SQL queries you could use SQL Server Management studio.
As a practice, when you’re trying to test the data, it’s important to get the data right in your queries before you place that data in your report.
Groups are powerful
This tip is the most important for developing reports efficiently. By using groups, you can have a dynamic report that reduces the amount of repeatable development.
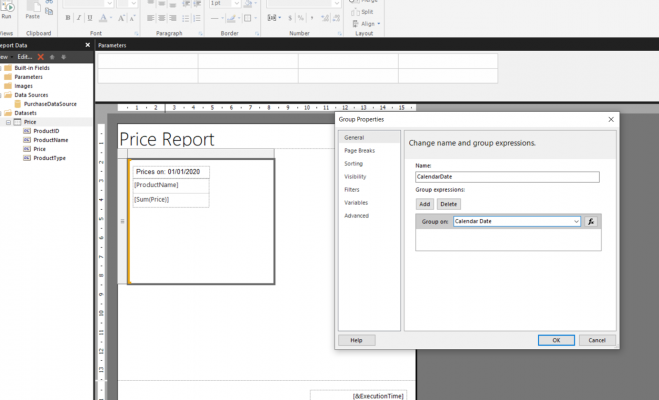
As an example, let’s say that you have a report that has the same table repeated, with the same data but each table has a different date associated with it.
Wouldn’t it be great if you could create and format this table once, and then have it repeat? Well, you can, if you place the table inside a Tablix it will repeat based on the date. To do this;
- Create a new table.
- Reduce the table down to one cell.
- Place a rectangle inside that cell.
- Change the row group properties to group on the repeating value
Create a dataset for your parameters
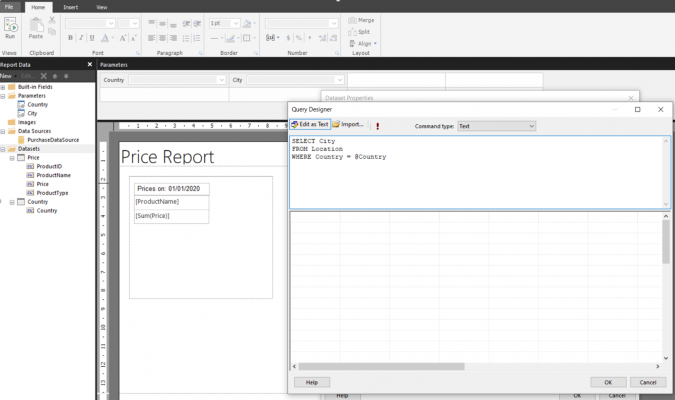
Instead of hard coding your parameters, or having the user type the parameter, it is preferable to have a list that the user can choose from. To do this, create a dataset, have just your field in the dataset, and then link the parameter to the query.
As practice, we should also cascade our parameters. If we have a parameter for a country and then one for a city, when we choose a value for the country parameter, we should only then be able to choose the corresponding city parameters inside that country. To do this, have a dataset for the country parameter, a dataset for the city parameter and then filter the city dataset by the country parameter.
DAX Queries
When using DAX for SSRS, you should use a general outline for your DAX queries. Use the following pattern below with variables, data columns, filters, and measures:

David Stelfox’s blog explains this in more detail and is a great reference for writing DAX for SSRS.
Introduction to Data Wrangler in Microsoft Fabric
What is Data Wrangler? A key selling point of Microsoft Fabric is the Data Science
Jul
Autogen Power BI Model in Tabular Editor
In the realm of business intelligence, Power BI has emerged as a powerful tool for
Jul
Microsoft Healthcare Accelerator for Fabric
Microsoft released the Healthcare Data Solutions in Microsoft Fabric in Q1 2024. It was introduced
Jul
Unlock the Power of Colour: Make Your Power BI Reports Pop
Colour is a powerful visual tool that can enhance the appeal and readability of your
Jul
Python vs. PySpark: Navigating Data Analytics in Databricks – Part 2
Part 2: Exploring Advanced Functionalities in Databricks Welcome back to our Databricks journey! In this
May
GPT-4 with Vision vs Custom Vision in Anomaly Detection
Businesses today are generating data at an unprecedented rate. Automated processing of data is essential
May
Exploring DALL·E Capabilities
What is DALL·E? DALL·E is text-to-image generation system developed by OpenAI using deep learning methodologies.
May
Using Copilot Studio to Develop a HR Policy Bot
The next addition to Microsoft’s generative AI and large language model tools is Microsoft Copilot
Apr