With the release of SQL Server 2016 CTP3 the inclusion of R has been a
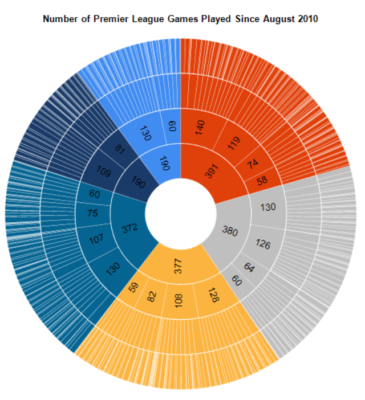
The Sunburst is the second of the new chart types in Reporting Services 2016. It was
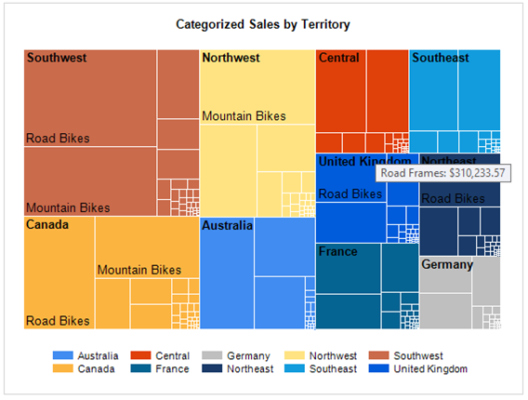
The current instalment in my SSRS 2016 blog series focuses on one of the two
I will be writing a series of blogs that specifically focus on SQL Server Reporting
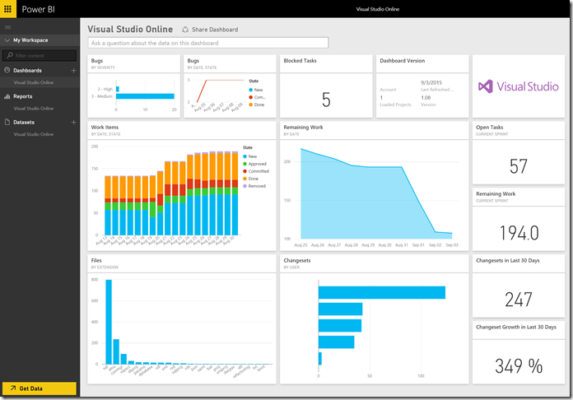
I’ve recorded a short video (< 7 minutes) showing how Azure ML, Power BI and
The Bing map engine behind the map visualisation in Power BI is very intuitive allowing
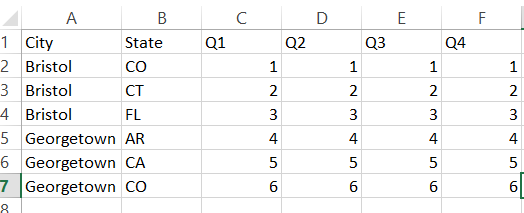
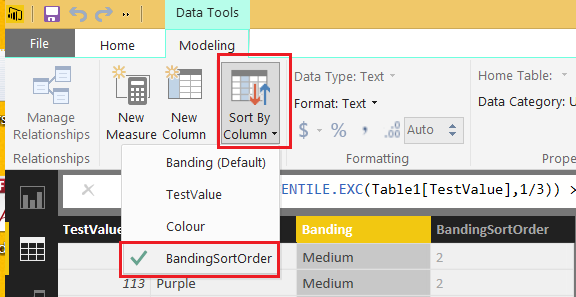
Recently I’ve been looking at applying dynamic bandings for a client. What was required was
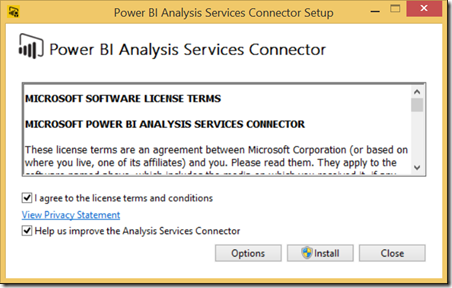
The Power BI Analysis Services Connector is used in order to expose a Tabular model
I spend a fair amount of time championing the use of data and analytics around
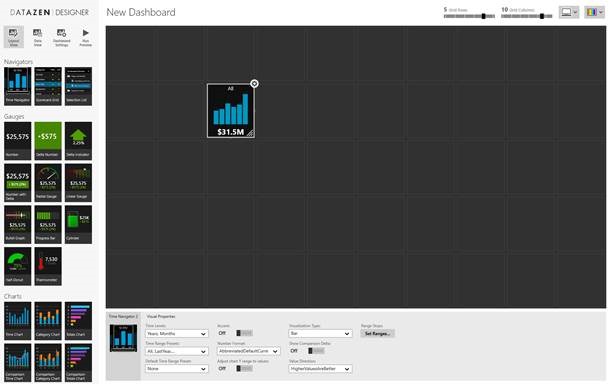
Microsoft has recently acquired Datazen, a powerful platform for data visualization. From the presentation to