In this and other following blog posts over the coming weeks, I’ll be compiling some information gathered from some research done on a capability in Power BI which has increased in popularity and usage: ArcGIS Maps.
As Jimmy Buffett said “Without geography you’re nowhere” – so hopefully this capability will help us get to somewhere
So… what is ArcGIS?
In a nutshell, ArcGIS is a software-as-a-service platform that allows the creation, discovering, management, sharing, analysis and visualization of location-based and geographic data through maps, applications and reports. Esri (Environmental System Research Institute), which developed, hosts and administers ArcGIS, has partnered with Power BI and as of 2016 ArcGIS Maps for Power BI has been included and is now a built-in feature in Power BI to provide enhanced mapping capabilities. GIS (Geographical Information Systems) analysis is beneficial to different domains or industries including, but not limited to business, urban planning, crime mapping, resource optimization, transport planning/ management (public & private), education, assessment of natural disasters/ hazards, healthcare etc.
What is possible with ArcGIS?
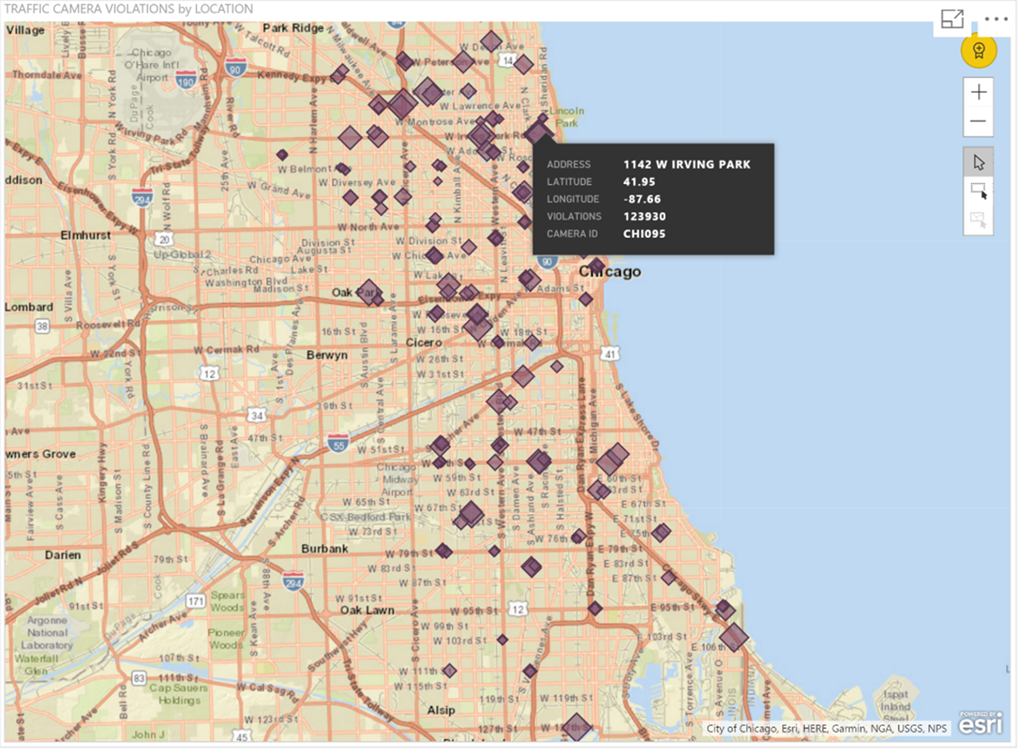
The following is just a glimpse of some simple map-related visuals that may be acquired through ArcGIS Maps for Power BI.


How does ArcGIS differ from the previous map visualizations?
ArcGIS has various features and capabilities, which are to be summarized and explained further in the upcoming blogs. Prior to the ArcGIS Maps for Power BI introduction, Power BI had limited mapping capabilities through its own map function, especially when compared to other suppliers and platforms such as Tableau. Apart from the enhanced visual appearance (such as changes in themes, ability to add layers of demographic data etc.), this tool allows comparability between location-based data and features mainly through the selection methods of points on the map (the different selection methods also to be explained further). It helps provide context to geographic data and provide accurate spatial analysis. It’s worth keeping in mind that ArcGIS is intended to display and interact with data that is managed by Power BI. Hence, it’s not intended to provide data enrichment in the form of adding data from ArcGIS Maps for Power BI itself to your own business data.
You excited? Let’s do this…
Enabling ArcGIS in Power BI service
If you’re using Power BI through app.powerbi.com, you might need to enable ArcGIS Maps for Power BI. This can be done by clicking on the cog icon in the top right section of the menu bar and open Settings. Under the General tab, select ArcGIS Maps for Power BI checkbox.

Power BI will have to be restarted after that, and the ArcGIS Maps for Power BI icon will then be available in the Visualizations pane when opening a report in Editing view.
When using Power BI Desktop, ArcGIS Maps is normally enabled by default, however it has an option which could still control the enabling and disabling of this capability, under the Security tab in Options & Settings > Options, as follows:

ArcGIS Maps is unavailable in Power BI Embedded edition and Power BI service embedding (PowerBI.com).
Creating an ArcGIS map in PowerBI
To add a map to the report, use the ArcGIS Map for Power BI Visualization from the visualization pane – icon shown below:

This will add a new ArcGIS Maps for Power BI visualization on the report page.

The dataset in the Fields pane can then be used to populate the field wells and add data to the report.
The following are the location field wells that can be used:
- Location – Values dragged within this field well should be location-based like single field address, postcode or country name to display the features on the map.
- Latitude – Values dragged here will define part of a map coordinate (north to south position). If this is used, the corresponding longitude field must also be used. In the modelling tab, a data category with the same name also exists to transform the column in the data set.

- Longitude – Values dragged here will define part of a map coordinate (east to west position). If this is used the corresponding latitude field must also be used. The data category Longitude also exists.

The same data categorization can also be applied on the City, Country, Province/State and other data to be considered location based. When done, a globe icon will show next to fields’ name to show that the field is marked by Power BI as containing geographic information – as follows:

For accurate plotting of data on the map, latitude and longitude values are suggested to be used if these values are available. If you fill all of the Location, Latitude and Longitude field wells, only the Latitude and Longitude will be considered by ArcGIS Maps for Power BI to map data and the Location field will be ignored. The country will still however be considered for the information that is to be shown when hovering over the mapped point – as per below:

In addition to these, the Size, Color, Time and Tooltips can be used as non-location fields that will affect how features look on the map. As best practice it is suggested to first add the location-based data before adding these to render the points on the map.
- Size – Numerical values could be added to this field well to show map features based on size. For instance, when analyzing earthquake data, dragging the magnitude value here will show the extent of the scale. Similarly, by dragging the population field, the location symbols on the map will be automatically rendered in proportional sizes based on the population value.
- Color – This field well could be used for both numerical and categorical values to differentiate the map features according to the colour ramp. For instance, a light-to-dark colour ramp will help identifying low-to-high numerical data values like sold quantity, whilst different colours could be used for categorical data like brand preference. Size and Color could be used together both for different or same attributes in the same map.
- Time – This field well could be used to animate the features on the map for temporal data fields according to date, time or date and time. It helps understand how measure values occurred through the time, and will prompt the time slider.
- Tooltips – As for other visualizations, this can be used to provide definitions of information that appears in tooltips, and multiple fields can be used here.
It seems quite straight forward, doesn’t it? Well, in the next blog post we will be going deeper into how to edit the ArcGIS map and how to utilize some of the beneficial functions this tool offers!
Pareto Charts in Power BI and the DAX behind them
The Pareto principle, commonly referred to as the 80/20 rule, is a concept of prioritisation.
Apr
Databricks: Cluster Configuration
Databricks, a cloud-based platform for data engineering, offers several tools that can be used to
Apr
AI Assistance in Microsoft Fabric
The exponential growth of Large Language Models (LLMs) couples with Microsoft’s close partnership with OpenAI
Apr
10 reasons why it’s worth the effort to understand the value of your data
“If leaders really want to create a data driven culture, the journey starts with them!
Apr
Content Safety in Azure AI Studio
Azure AI Content Safety is a solution designed to identify harmful content, whether generated by
Apr
Model Benchmarks in Azure AI Studio
In the constantly changing field of artificial intelligence (AI) and machine learning (ML), choosing the
Apr
Celebrating International Women’s Day: from Classroom to Code
As we celebrate International Women’s Day, I want to share my journey of breaking stereotypes
Mar
Pretty Power BI – Adding Pagination to Bar Charts
Good User Experience (UX) design is crucial in enabling stakeholders to maximise the insights that
Feb