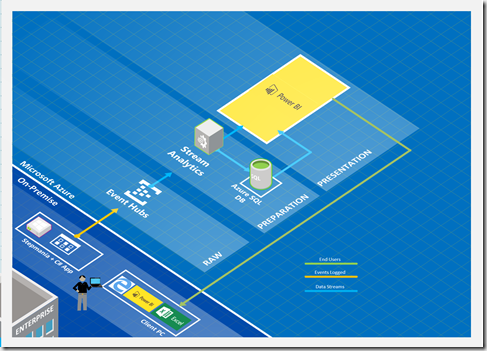
Following the DISCO theme, Adatis decided to present all the SQLBits attendees with a challenge based on the game Dance Dance Revolution. At the end of the game, the players were presented with two Power BI dashboards, one that streamed the data in near real time and the other representing historical data. This blog will detail the different components used in the demo.

(High Level Architecture)
The starting point
The first requirement was to have a game that could run on a laptop and store the output data in a file. Based on the theme of the conference, we chose the game Stepmania 5 (https://www.stepmania.com/download/). After understanding how it worked and what type of details we wanted to capture, we adapted the program so it was possible to save the output in a TXT file every time a key was pressed. Following is an example of how the data was structured.
{“Player”: “0”, “Row”: “768”, “Direction”: “Left”, “NoteType”: “Tap”, “Rating”: “OKAY”, “Health”: “Alive”, “Combo”: “0”, “Score”: “0”, “Artist”: “Katrina feat. Sunseaker”, “Song”: “1 – Walking On Sunshine”, “Difficulty”: “Easy”}
Capturing player details
To complement the game output, we decided to create an MVC application that had two functions, capturing the player details in an Azure SQL DB, and, upload a new Game ID along with the player details to a reference BLOB stored in an Azure Storage Container.
Sending the data to an Event Hub
Since we wanted to stream the data in near real time, we needed an application that could read the data from the output file as soon as it was updated. To achieve this, we built a C# application that was sending the data to an Event Hub. To make sure we didn’t upload duplicate data, we implemented a logic that compared the last row with the previous one. If they were different, the row was uploaded and if not, the program would wait for the next input.
Distributing the data
To distribute the data between the Azure SQL DB and the Power BI dataset, we used two separate Stream Analytics Jobs.
The first job was using the Event Hub and the reference BLOB as inputs and the Azure SQL DB as output, while the second job was using the same inputs but having a Power BI dataset as an output. Due to the dataset limitations, we ensured that all the formatting was applied in the Stream Analytics Query (eg. cast between varchar and bigint, naming conventions, …).
Power BI streaming datasets
In this scenario, the streaming datasets only work properly when created by the Stream Analytics Job. Any of the following actions invalidates the connection between the jobs and the dataset:
· Create the dataset in Power BI
· Change column names
· Change column types
· Disable the option Historic data analysis
When the dataset crashes, the only solution to fix the issue is to delete and re-create it. As a result, all the linked reports and dashboards are deleted.
Representing the data
By the time the demo was built, the connectivity of live datasets to the Power BI Desktop was not available, which means the live streaming dashboard was built using the online interface.
It is important to note that it is impossible to pin an entire page as a dashboard when using live datasets since it won’t refresh as soon as the data is transmitted. Instead, each individual element must be pinned to the dashboard, adding some visual limitations.

The performance of the players could be followed by checking the dashboard streaming the results in near real time. The use of the word near was used several times in the blog because the streaming is limited not only by the internet connection but also by the Power BI concurrency and throughput constraints, meaning the results were not immediately refreshed.
The second report was built using Power BI Desktop and was connected to the Azure SQL DB.

At the end of the game, the players could obtain the following information:
· Who was the winner
· How did they perform during the game
· The number of hits for each rating
· Which direction they were more proficient
Pareto Charts in Power BI and the DAX behind them
The Pareto principle, commonly referred to as the 80/20 rule, is a concept of prioritisation.
Apr
Databricks: Cluster Configuration
Databricks, a cloud-based platform for data engineering, offers several tools that can be used to
Apr
AI Assistance in Microsoft Fabric
The exponential growth of Large Language Models (LLMs) couples with Microsoft’s close partnership with OpenAI
Apr
10 reasons why it’s worth the effort to understand the value of your data
“If leaders really want to create a data driven culture, the journey starts with them!
Apr
Content Safety in Azure AI Studio
Azure AI Content Safety is a solution designed to identify harmful content, whether generated by
Apr
Model Benchmarks in Azure AI Studio
In the constantly changing field of artificial intelligence (AI) and machine learning (ML), choosing the
Apr
Celebrating International Women’s Day: from Classroom to Code
As we celebrate International Women’s Day, I want to share my journey of breaking stereotypes
Mar
Pretty Power BI – Adding Pagination to Bar Charts
Good User Experience (UX) design is crucial in enabling stakeholders to maximise the insights that
Feb